


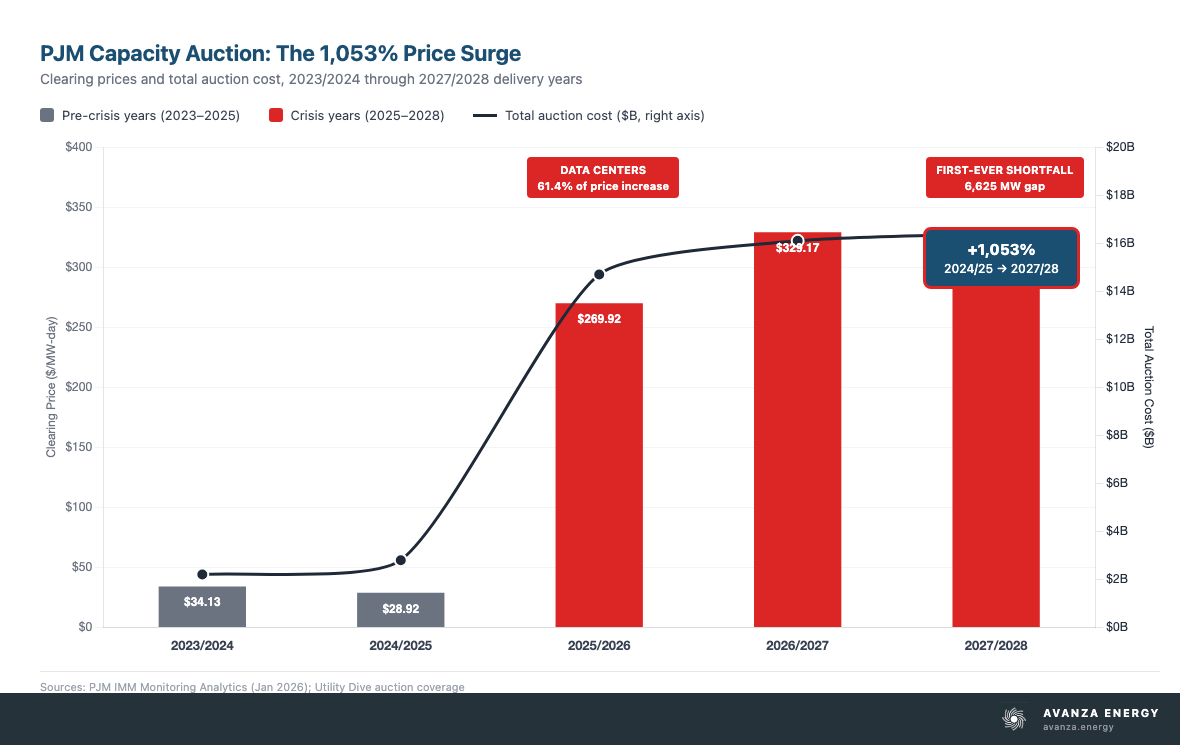
In December 2025, PJM Interconnection held its most expensive capacity auction in history. The grid operator, which serves 67 million people across 13 states and Washington, D.C., cleared at $333.44 per megawatt-day, the federally approved price cap, for the third consecutive year. Total cost: $16.4 billion.¹, ²
That number alone would make this story worth telling. The more important detail sits inside it: $6.5 billion of that $16.4 billion, 40% of the entire auction, was attributable to data center load, according to PJM's own Independent Market Monitor (IMM).¹, ³ Of that $6.5 billion, $6.2 billion came from data centers not yet built.¹
Ratepayers across PJM territory are paying today, in their current electricity bills, for capacity reserved to serve facilities that may never come online. If those data centers are never constructed, the money doesn't get refunded. The grid operator came up 6,625 megawatts short of its own reliability target, the first miss in the capacity market's 18-year history, in the same auction where costs hit their record.², ⁴
Paying more and getting less. That is the story.
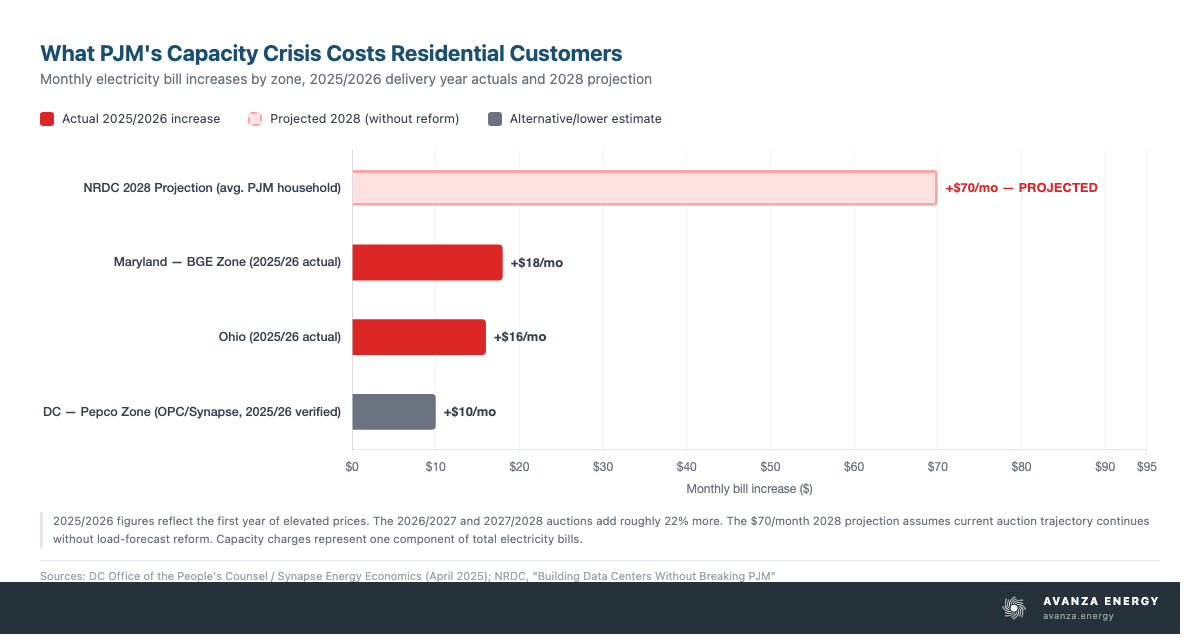
The three-year price trajectory makes the scale concrete. Just two auction cycles earlier, the 2024/2025 delivery-year auction cleared at $28.92 per megawatt-day. The 2027/2028 auction cleared at $333.44 per megawatt-day, a 1,053% increase.¹, ⁵ For average households in PJM territory, the NRDC projects bill increases of roughly $70 per month by 2028 compared to pre-surge levels.⁶ In Washington, D.C., Pepco customers saw $10 per month added to bills from the 2025/2026 delivery year alone.⁷
How a Capacity Market Actually Works
To understand why this matters, and why reform is now inevitable, you need to understand what PJM is actually buying in these auctions, and how a number in a load forecast becomes a line item on your electricity bill.
PJM operates the Reliability Pricing Model (RPM), which runs forward auctions called Base Residual Auctions (BRAs). Each BRA procures capacity three years in advance for a specific delivery year — generators commit to be available during peak demand in exchange for capacity payments. The December 2025 auction procured capacity for June 2027 through May 2028.⁸, ⁹
The auction works in five steps.
Step 1: Set the requirement. PJM calculates how much capacity it needs by taking its forecasted peak load and adding an Installed Reserve Margin (IRM). The IRM is calibrated to a reliability standard called Loss of Load Expectation (LOLE), the probability of an outage event. PJM targets no more than a once-in-a-decade extreme weather event.¹⁰ For the 2027/2028 delivery year, that translated to a total requirement of approximately 152,102 megawatts, roughly 127,000 megawatts of forecasted peak load plus a 25,000-megawatt reliability buffer.
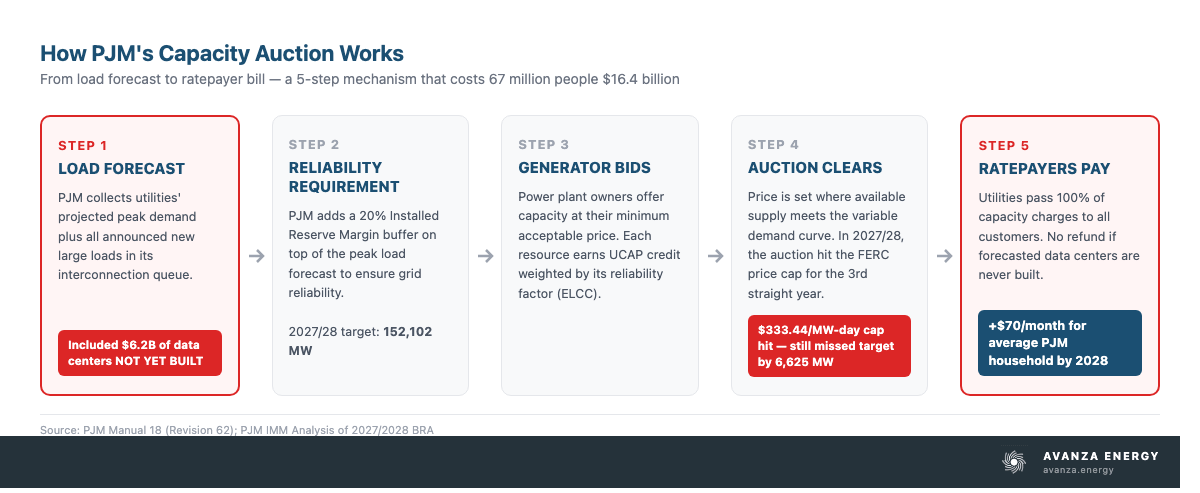
Step 2: Convert resources to reliability value. Every resource bidding into the auction converts its nameplate capacity to an Unforced Capacity (UCAP) value via an Effective Load Carrying Capability (ELCC) factor, the statistical probability the resource will be available during peak stress hours.⁹ A gas peaker with a reliable operating history earns more UCAP credit than a solar farm with variable output. Demand response resources cleared 7,299 megawatts of UCAP in the 2027/2028 auction after PJM updated demand response's ELCC factor from 69% to 92%.
Step 3: Run the auction. Generators submit bids. PJM clears where supply meets a downward-sloping demand curve called the Variable Resource Requirement (VRR) curve, which pays more when supply falls short of the reliability requirement and less when it exceeds it. The curve has a hard cap at the Net Cost of New Entry.⁹
Step 4: Hit the cap. When the market cannot satisfy the demand curve below the cap price, the auction clears at the cap. In 2027/2028, that cap was $333.44 per megawatt-day. PJM cleared there for the third straight year and still came up 6,625 megawatts short of its requirement.², ⁴
Step 5: Allocate costs. Load-serving entities, the utilities and retail suppliers who serve end customers, pay based on their Peak Load Contribution (PLC), calculated as each customer's average demand during the five highest-demand hours of the prior summer.¹¹ Those costs pass through to retail electricity bills as monthly capacity charge riders. Every PJM ratepayer pays, residential, commercial, industrial.
The mechanism most people overlook is the one connecting load forecasts to monthly bills: the forecast doesn't just predict what customers will consume. It determines how much capacity PJM is required to buy. If PJM includes speculative data center load in its forecast, it must procure capacity to serve that load, even if those data centers never get built.
PJM's IMM stated this directly in its auction analysis: "The extreme uncertainty in the load forecasts based on uncertainty about the addition of large data center loads is also unique and unprecedented and raises questions about the meaning of clearing a capacity auction based on those forecasts."¹
The Scale of PJM's Data Center Footprint
PJM's problem is geographically concentrated and then geographically generalized. Both things at once.
Northern Virginia, anchored by Amazon's "Data Center Alley," sits in PJM's Dominion Zone. In the 2025/2026 auction, the first year the price spike became visible, the Dominion Zone cleared at $444.26 per megawatt-day versus $269.92 per megawatt-day for PJM as a whole.⁵ That gap was the market's signal that the Northern Virginia supply-demand imbalance was acute. By the 2026/2027 and 2027/2028 auctions, the price cap had spread uniformly across all PJM zones. The zone-specific imbalance had become a systemwide problem.
PJM's 2026 Long-Term Load Forecast projected 32 gigawatts of peak load growth from 2024 to 2030, with 94% of that growth attributed to data centers.¹² The annualized summer peak growth rate reached 3.6% per year, versus the 0.3% rate in PJM's 2021 forecast, before data center proliferation reset the numbers. In the Dominion Zone alone, the 2025 forecast called for more than 20,000 megawatts of data center growth by 2037, versus just 5,700 megawatts in the 2022 forecast, a 3.5x upward revision in three years.¹²
Wood Mackenzie analysis put collective utility forecasts for new large load growth in PJM at 55 gigawatts by 2030 and 100 gigawatts by 2037.¹³
The load forecast revision also contains a self-correcting mechanism that arrived too late. In late 2025, PJM trimmed its summer 2028 peak load forecast by 4.4 gigawatts and its summer 2027 forecast by roughly 4 gigawatts after implementing stricter vetting through the Load Adjustment Request Implementation framework.¹⁴ PJM accepted only 34 gigawatts of the approximately 60 gigawatts submitted by utilities for 2030, a 43% rejection rate. The rationale: developers routinely submit redundant interconnection requests across multiple zones to hedge against transmission constraints, inflating the apparent pipeline. PJM's pre-2025 process had no mechanism to distinguish a fully-financed, shovel-ready project from a speculative site assessment.
But the 2027/2028 auction used the older, higher forecasts before those corrections were applied. The record $16.4 billion cost was locked in before PJM could update its numbers.¹ That is the mechanism of the speculative load trap: the correction lags the commitment.
The $6.2 Billion Asymmetry
Here is the structural injustice that has turned this into a policy crisis rather than just an economics story.
PJM's IMM calculated precisely: including forecast data center load, versus only the load from data centers already operating, increased total RPM revenues by $6,244,523,827, a 61.4% increase above what the auction would have cost without speculative data center load.¹ That number, $6.2 billion, is the financial consequence of one decision: whether speculative demand should drive capacity procurement.
The asymmetry runs in one direction only. Ratepayers pay for capacity reserved to serve speculative load. If the data centers materialize, the capacity was needed. If they don't, the capacity was procured unnecessarily, and the cost has already been collected and will not be refunded. The data center developer, whose unverified request drove up the requirement, faces no financial penalty.
Three mechanisms compound the problem.
The forecasting gap is structural: utilities in data center-dense zones submitted enormous pipeline numbers reflecting their customers' announced project lists, which include everything from fully-financed construction to early-stage site assessments. PJM's pre-2025 vetting process could not distinguish between them.
The interconnection hedge amplifies the problem: data center developers routinely submit redundant requests across multiple utility service territories to protect against transmission constraints in any one zone. Each request contributes to the load forecast that drives the capacity requirement.
The cost pass-through completes the trap: capacity charges flow from ratepayers to utilities to PJM to generators. The NRDC described the destination of those payments precisely: "Virtually none of this rate hike will go to investments in new power plants and infrastructure; instead, almost all of it will be windfall payments to owners of existing power plants, which face no meaningful competition."⁶ As our analysis of the utility rate structure problem documented, this cost pass-through dynamic — where large loads impose costs that residential customers absorb — is a feature of how PJM allocates charges, not a bug.
The primary financial beneficiaries of elevated PJM capacity prices are owners of existing generation, nuclear, natural gas, and coal plants that collect capacity payments without requiring new investment. Constellation Energy and Vistra Energy, two of the largest existing-capacity owners in PJM, have each cited positive capacity market results in investor communications.
Paying More, Getting Less: The Reliability Shortfall
The capacity market is designed to guarantee reliability. That guarantee broke down in December 2025.
PJM's auction procured 134,479 megawatts of UCAP from generation sources. Adding Fixed Resource Requirement areas brought total secured capacity to approximately 145,479 megawatts. The reliability requirement was 152,102 megawatts. The shortfall: 6,625 megawatts.⁴
The achieved reserve margin was 14.8%, against a 20% IRM target. This was the first time since the capacity market launched in 2007 that PJM failed to meet its reliability requirement across the entire region, including areas with their own local capacity plans.², ¹⁵
FERC Chairman Laura Swett called it "very concerning." FERC Commissioner David Rosner called it "unacceptable" and demanded PJM file meaningful rule changes to address the generation interconnection and financing barriers driving the supply gap.¹⁶ The market worked exactly as designed. Supply responded to the highest prices in its 18-year history. It simply could not grow fast enough to meet a demand projection that was partly fictional.
The supply-side constraint amplifying the crisis is PJM's interconnection queue. Average wait time from application to commercial operation grew from under two years in 2008 to over eight years in 2025. In 2025 alone, developers cancelled 38 gigawatts of projects, more than ten times the amount of new generation that successfully connected that year.¹⁷ Network upgrade costs reached $240 per kilowatt in 2020-2022, up from $29 per kilowatt in 2017-2019.¹⁷ The combination — soaring costs and years-long queues — means that even at $333.44 per megawatt-day, the price signal has not produced enough new supply to close the gap. Our February 2026 analysis of the interconnection crisis showed how these same queue dynamics were already forcing hyperscalers toward behind-the-meter generation as the only path to timely power delivery.
The NERC 2026 Summer Reliability Assessment noted that PJM has adequate installed reserves for summer 2026, but projects margins will fall below requirements by 2029 without accelerated supply additions.¹⁸ Bloomberg analysis estimates PJM could face a supply shortfall of up to 60 gigawatts over the next decade if major capacity additions don't materialize.¹⁹
The price signal is working against reliability, not for it. The same forecast that drove costs to a record produced a shortfall. The market is not malfunctioning — it is optimizing correctly against a requirement that is partially based on speculation.
The full analysis continues below for paid subscribers, including the Google/Voltus BYOC escape valve, detailed regulatory reform landscape, two scenarios for how this resolves, and strategic implications by stakeholder — with comprehensive citations.
