


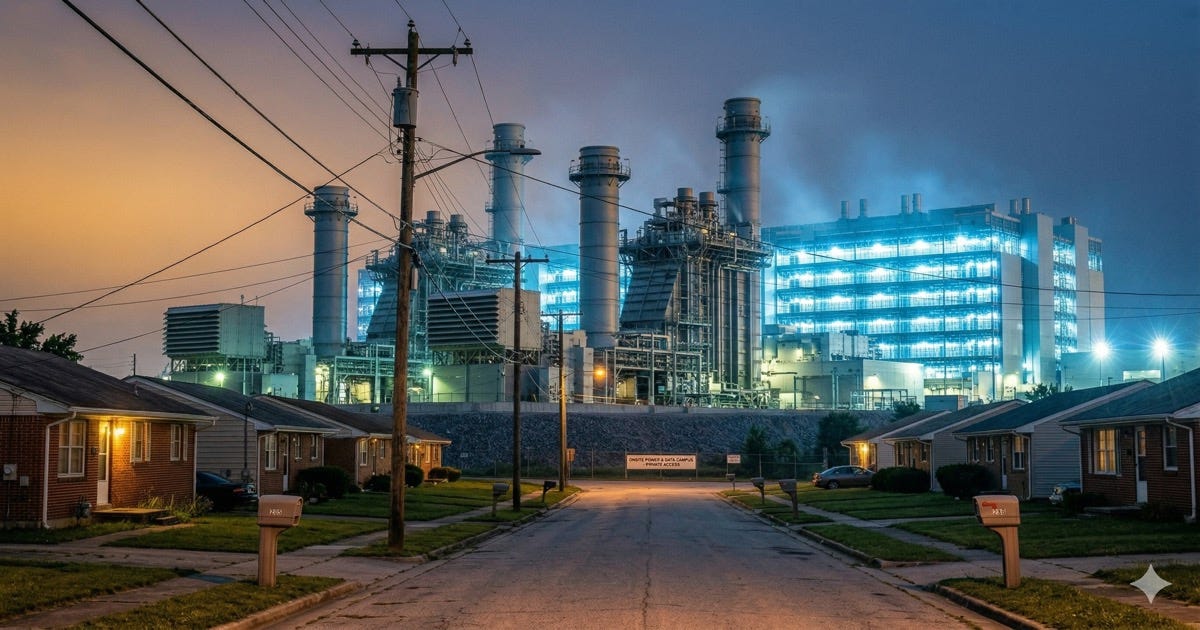
On March 4, 2026, seven of the most powerful companies on earth — Amazon, Google, Meta, Microsoft, OpenAI, Oracle, and xAI — gathered at the White House to sign the Ratepayer Protection Pledge. President Trump’s fact sheet called it “a guarantee that data centers’ energy needs will not increase household electricity costs for American citizens.”1
Nine days later, the pledge appeared in the Federal Register as Document 2026-04645, declaring that the commitments “effectuate the national policy of the United States.”2 The language carried the weight of formal administrative action.
The mechanism the pledge endorses — hyperscaler behind-the-meter (BTM) self-generation — is the precise driver of higher residential electricity costs. Not a risk. Not a possibility. The documented, academically confirmed, mathematically predictable mechanism that causes residential rates to rise when large commercial customers leave the rate base.
Virginia’s official legislative research body projects that data centers will add $444 per year to the average residential electricity bill by 2040.5 That projection assumes data centers remain on the grid. When the hyperscalers who signed the pledge build their own gas turbines and reduce grid consumption by 80 to 90 percent — which every one of the seven signatories is already doing — the residential impact is higher.
The pledge doesn’t need to be cynical to be harmful. It just needs to be followed.
What the Pledge Actually Says
The four core commitments of the White House Ratepayer Protection Pledge are:
“Build, bring, or buy” new generation resources and electricity needed to satisfy energy demands, and pay for all new power delivery infrastructure upgrades to service their data centers
Voluntarily negotiate new, separate rate structures with their utilities and relevant state governments, and pay those rates whether or not they use the electricity
Invest in local communities and coordinate with grid operators to contribute to a more reliable grid
Hire and train talent from within communities where they build and operate data centers1
The pledge’s critical word is in commitment 2: “voluntarily.” There is no enforcement mechanism. No federal agency was directed to create binding rules. No penalties exist for noncompliance. No independent audit requirement. No methodology for determining whether commitments have been met.
Energy industry analysts were direct. “Without that translated into binding contracts or tariff language,” Latitude Media reported, “it’s basically a big press event.”16 A Harvard Law School expert cited in the same analysis put the structural problem plainly: “The White House has the bully pulpit but no legal authority to impose new rate structures that ensure data centers pay their full costs of service.”16
The more important omission is what the pledge never addresses: existing data centers shifting to on-site generation and reducing their grid consumption.
Commitment 1 — “build, bring, or buy” new generation — explicitly permits behind-the-meter self-generation as a fully compliant option. A company that builds a gas turbine on its campus, reduces grid consumption by 90 percent, and maintains only minimal standby service satisfies every term of the pledge. The pledge does not restrict BTM generation. It does not set minimum grid consumption requirements. It does not address whether BTM-migrating customers must pay their proportional share of the grid infrastructure built to serve them.
This is not a technicality. As of January 2026, the pipeline of gas-fired power capacity explicitly earmarked for data center service in the United States reached 97 gigawatts (GW) — up from 4 GW just one year earlier, a 24-fold increase in twelve months.11 Every one of the seven pledge signatories has active BTM deployment already underway or contracted. The pledge they signed permits all of it.
The Death Spiral: A Concept Introduced in 2013
The mechanism by which large customer defection raises residential rates has formal academic documentation. In January 2013, Peter Kind published “Disruptive Challenges: Financial Implications and Strategic Responses to a Changing Retail Electric Business” for the Edison Electric Institute (EEI) — the investor-owned utility trade association.9 The report named the utility death spiral and described its five-step feedback loop:
Customers with financial means adopt self-generation, reducing grid electricity consumption
Utility revenues fall, but fixed costs remain — transmission lines, distribution infrastructure, debt service on capital investments already made
Fixed costs must now be recovered from a smaller pool of remaining customers, requiring rate increases
Higher rates create additional economic incentive for customers to invest in self-generation
The cycle repeats, each iteration accelerating the next
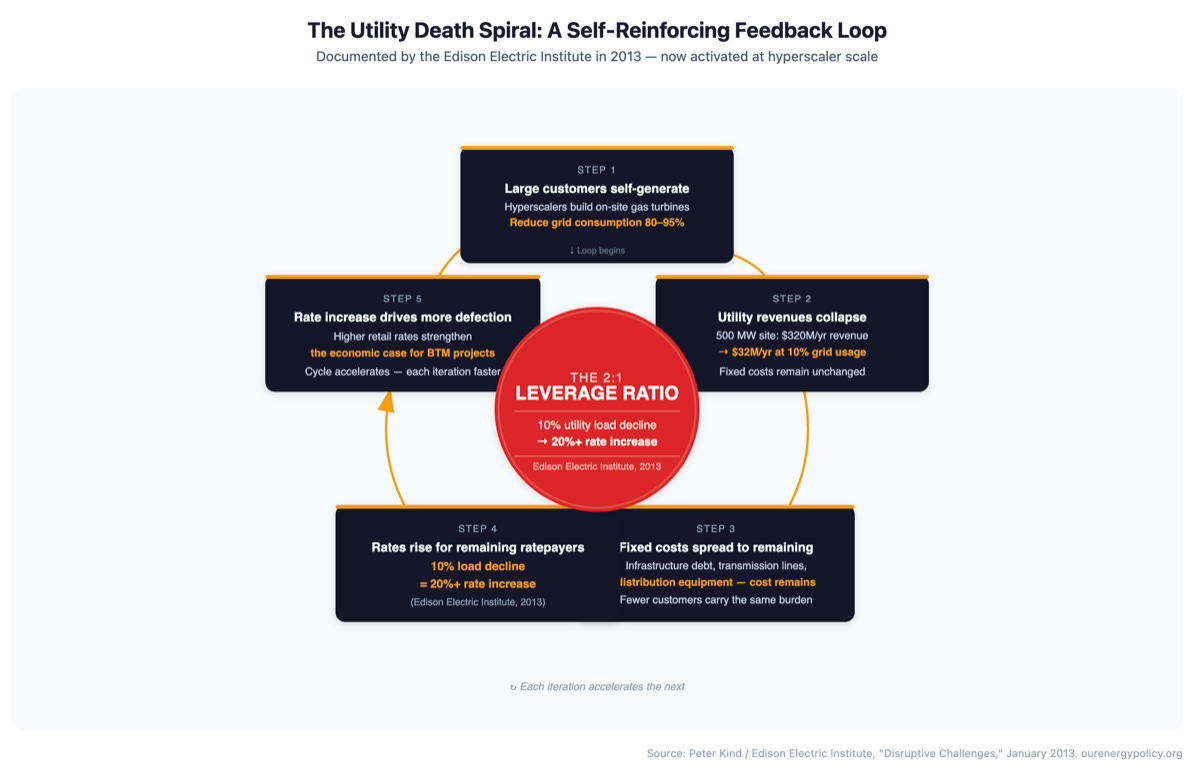
The quantified relationship Kind documented: a 10 percent decline in utility load causes electricity prices to rise by at least 20 percent.9 This 2:1 leverage ratio is the mathematical engine of the spiral. A peer-reviewed study in Applied Energy confirmed the mechanism using system dynamics modeling, finding that under high adoption rates and rising utility costs, the spiral becomes self-sustaining.10
The mechanism operates through a specific design flaw in utility rate structures. Utilities recover fixed infrastructure costs through two channels: a fixed monthly customer charge (averaging approximately $8 per month for investor-owned utilities) and a variable volumetric charge embedded in each kilowatt-hour (kWh) sold.14 The flaw: the majority of fixed costs are embedded in the volumetric charge, not the flat fee. When a large commercial or industrial (C&I) customer reduces its grid kWh purchases, it stops paying the fixed-cost recovery margin on those kilowatt-hours — but the underlying infrastructure built to serve it still exists, still costs money, and must be recovered from whoever remains on the grid. As we documented in our analysis of why electricity bills rise while technology gets cheaper, this cost-recovery mismatch is the structural flaw that makes large customer defection so damaging to remaining ratepayers.
Residential customers pay 16.48 cents per kWh. Industrial customers pay 8.13 cents per kWh.4 Residential customers pay more per unit of electricity — but a single hyperscaler campus running at 200 megawatts (MW) continuous load generates more annual volumetric revenue for the utility than tens of thousands of residential customers combined. The lower per-kWh industrial rate was offset by volume, making large C&I customers net contributors to grid cost recovery and allowing residential rates to remain lower than they would otherwise be. BTM technology has broken that assumption.
Why the Hyperscaler Version Is Categorically Different
The death spiral concept was originally developed to analyze the risk from residential rooftop solar adoption. Research from Lawrence Berkeley National Laboratory found that at 0.4 percent solar penetration, the national rate increase is approximately $0.0003 per kWh — negligible.14 Even at 10 percent solar penetration, rate impacts remain in the single-digit percentage range. California’s experience with NEM 3.0 — which cut rooftop solar export compensation by 75 percent after eight years of policy debate — illustrates both the limits of residential-scale defection and the slow regulatory response it triggers; our investigation of the solar cost-shift narrative found that California utilities had systematically overstated the residential solar burden by $10 billion to manufacture political support for that compensation cut.
Hyperscaler BTM defection operates at a fundamentally different scale for five structural reasons.
Event size. A single 500 MW hyperscaler campus represents the fixed-cost contribution equivalent of 50,000 to 100,000 residential solar installations but disappears in a single contract termination event rather than incrementally over years.
Completeness. A residential solar customer remains on the grid for backup and supplemental power, consuming grid electricity roughly 70 to 80 percent of the time. A hyperscaler with 95 percent BTM generation reduces its utility revenue by 90 to 95 percent in a single transition.
Speed. The current BTM pipeline barely existed 12 months ago — capacity earmarked for data centers grew 24-fold in a single year.11 Aeroderivative turbines — the fastest-to-deploy BTM option — can be operational within 30 to 90 days of site delivery for pre-assembled trailer-mounted units. No regulatory response cycle operates on that timeline.
Concentration. The BTM pipeline concentrates in five states — Virginia, Texas, Ohio, Georgia, and Arizona — making regional rate impacts acute rather than nationally diffuse.
Residential asymmetry. Renters represent 35 percent of U.S. households and have no rooftop option. Fixed-income households cannot access capital at hyperscaler rates. The customers with scale, capital, and site characteristics to achieve near-complete BTM defection are the seven companies who signed the pledge. The customers without those characteristics remain permanently on the grid and pay the difference.
The analogy is not rooftop solar. The analogy is a steel mill leaving town.
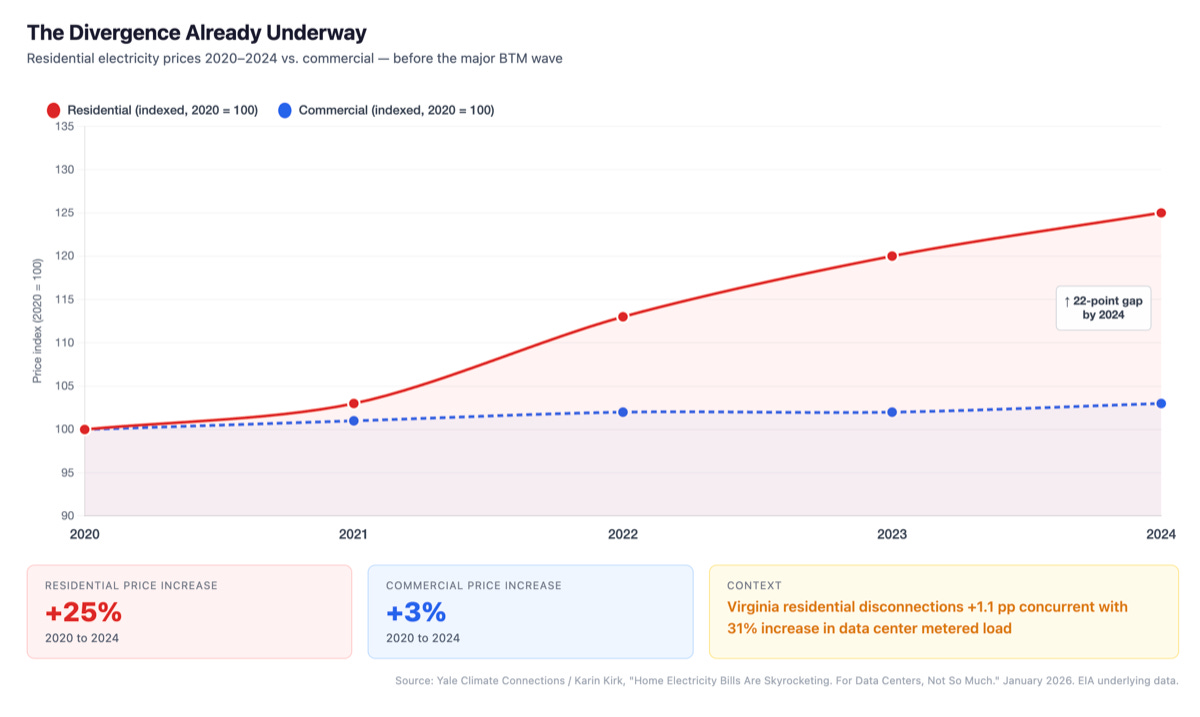
The divergence is already measurable. Residential electricity prices rose 25 percent from 2020 to 2024. Commercial electricity prices rose approximately 3 percent over the same period.22 In Virginia, residential utility disconnections rose 1.1 percentage points concurrent with a 31 percent increase in data center metered load.23 The death spiral mechanism is not a future risk. It is operating now, before the major BTM wave arrives.
The full analysis continues below for paid subscribers: detailed economic analysis, the Virginia case study, standby charge mechanics, and the legislative dynamic that makes the pledge more harmful than it appears.
Running the Math: Revenue Exposure and Rate Impact
The pledge’s framing treats hyperscaler self-generation as cost-neutral for residential ratepayers. The utility economics framework shows the opposite.
